When the Liquidation Storm Is Coming
Where Are You?
See the data price charts don't show: order book depth, liquidity distribution, position concentrations. 6 exchanges' unified DOM data, 90-day liquidation map, proprietary indicators — all on one platform.
 LIVE DEMO
Why Do You Keep Losing?
"You Can't See Half the Order Book"
Iceberg orders, hidden liquidity, absorption -- the real supply/demand balance doesn't show on charts. In 2025, 51.8% of US equities were traded in dark pools.
"You're Missing Liquidation Magnets"
You're opening trades without knowing at what price leveraged positions will be force-closed. Liquidation clusters act as price magnets -- price gets pulled toward these levels.
"You Don't Know Position Concentration"
You're trading without seeing where heavy long/short accumulation exists. You're missing whale accumulation zones.
"You Don't Know Which Side the Crowd Is On"
You don't notice when Crowding goes EXTREME. When Funding + L/S Ratio + Crowding all point in the same direction, reversal risk is at its highest.
What if you could see order book depth, liquidation map, position concentration, and proprietary indicators all on one screen?
What if you could see what they see?
What Traders Are Saying
A platform trusted by 2,500+ traders
Especially the new terminal is something else, like space age. Once you learn the nuances of Drift mode and Kumanchu, and repeat backtests to master them, it becomes incredibly easy and comfortable.
I caught Bitcoin's April 7, 2025 bottom thanks to the blue lights. I can't put a price on the group's patient, dedicated approach.
Everything I found difficult here became simple and clear. My trade success rate increased in ways I never expected.
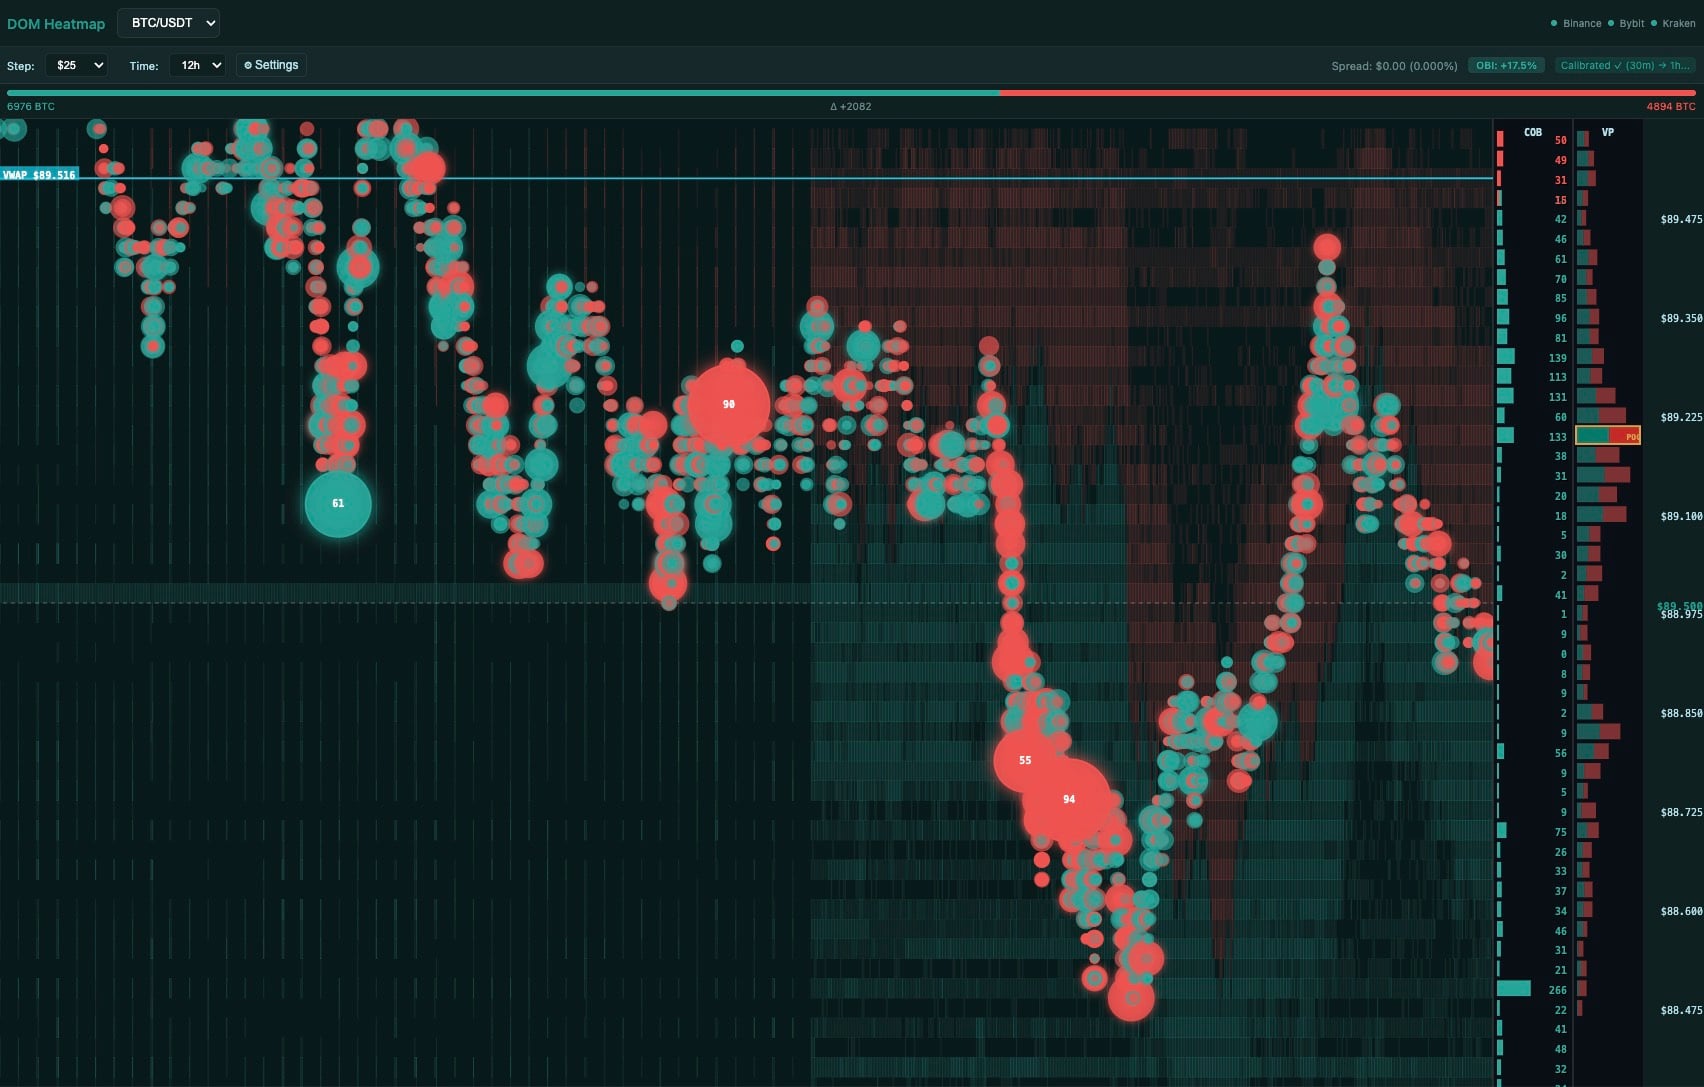
DOM Heatmap Pro
6 exchanges' unified order book data. Iceberg, Hidden Liquidity detection, CVΔ (Cumulative Volume Delta) and Historical S/R levels for professional DOM analysis.
- Iceberg Detection -- 3-factor confidence score
- CVΔ (Cumulative Volume Delta) -- real buy-sell balance
- Absorption detection -- invisible support/resistance
- Historical S/R Levels (S45x, R38x etiketleri)
- 50+ BTC trades with audio alert
- Binance + Bybit + Hyperliquid + OKX unified data
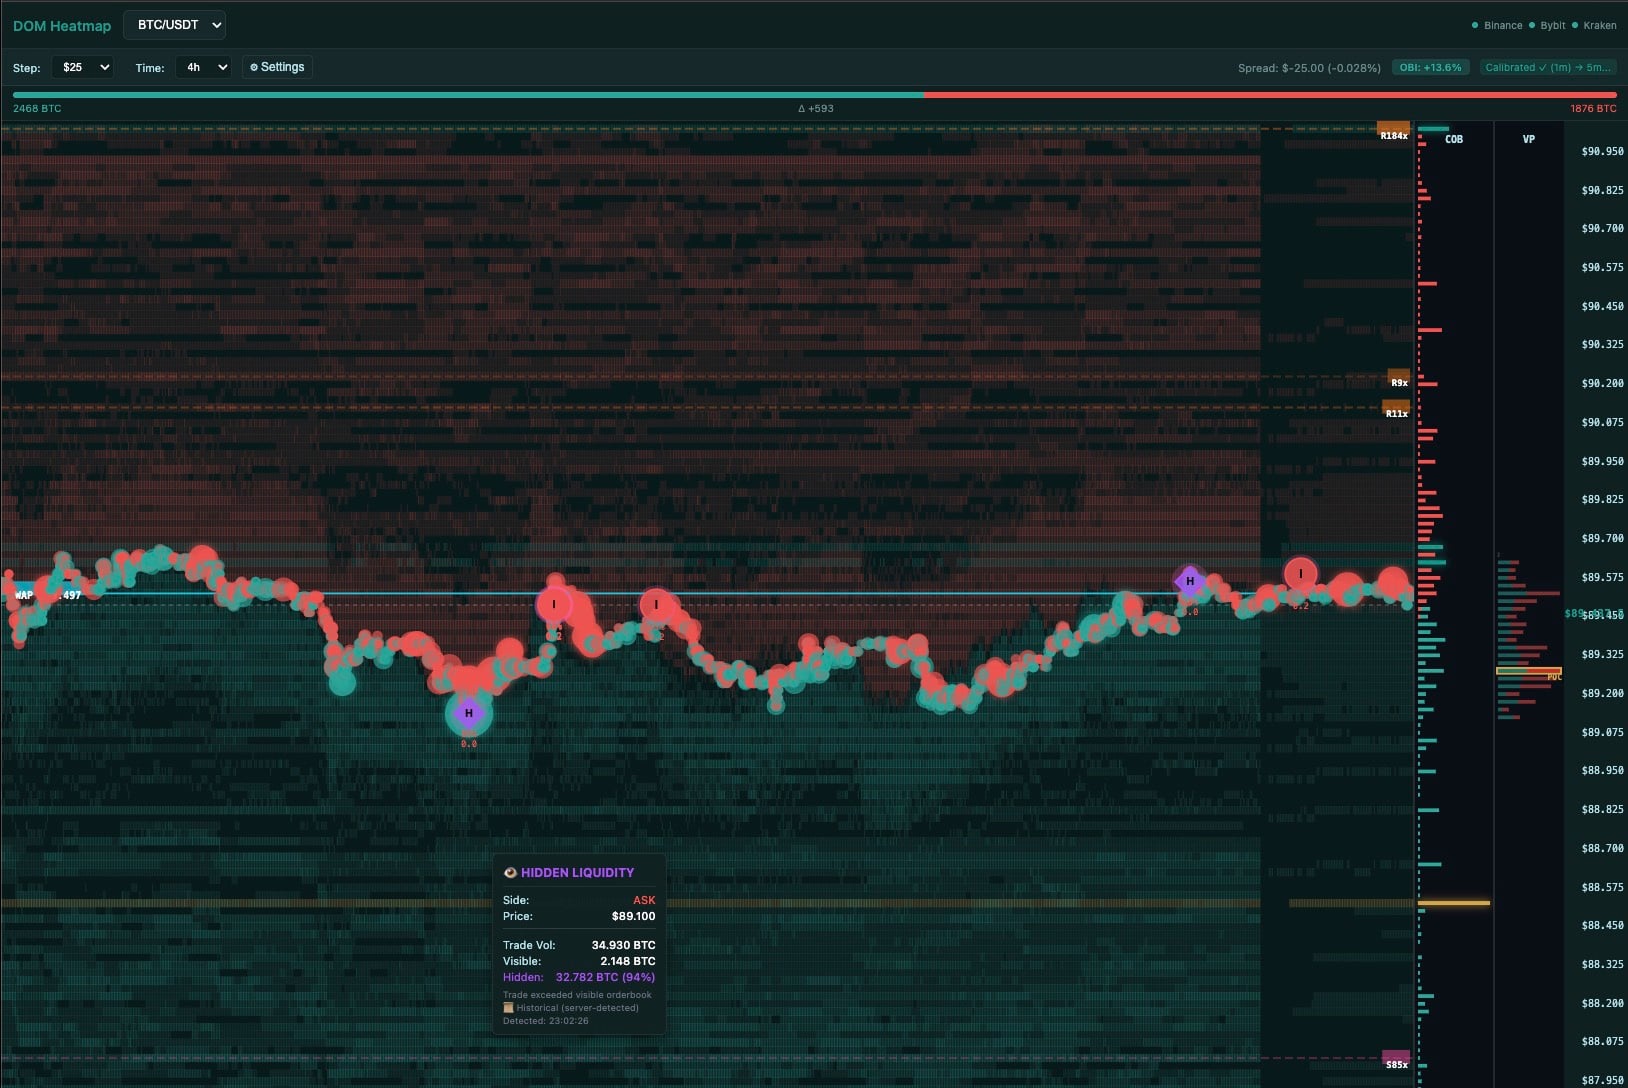
DOM Heatmap Pro
The order book on your screen is not the full picture. Now you can see the hidden icebergs.
😤 Sound Familiar?
"There's no resistance here, price will flow right through" you said, and went long. Then price never moved, kept getting sold at that level, and you got stopped out. "The market was manipulated" you said, and moved on...
No, it's not manipulation. Just incomplete data.
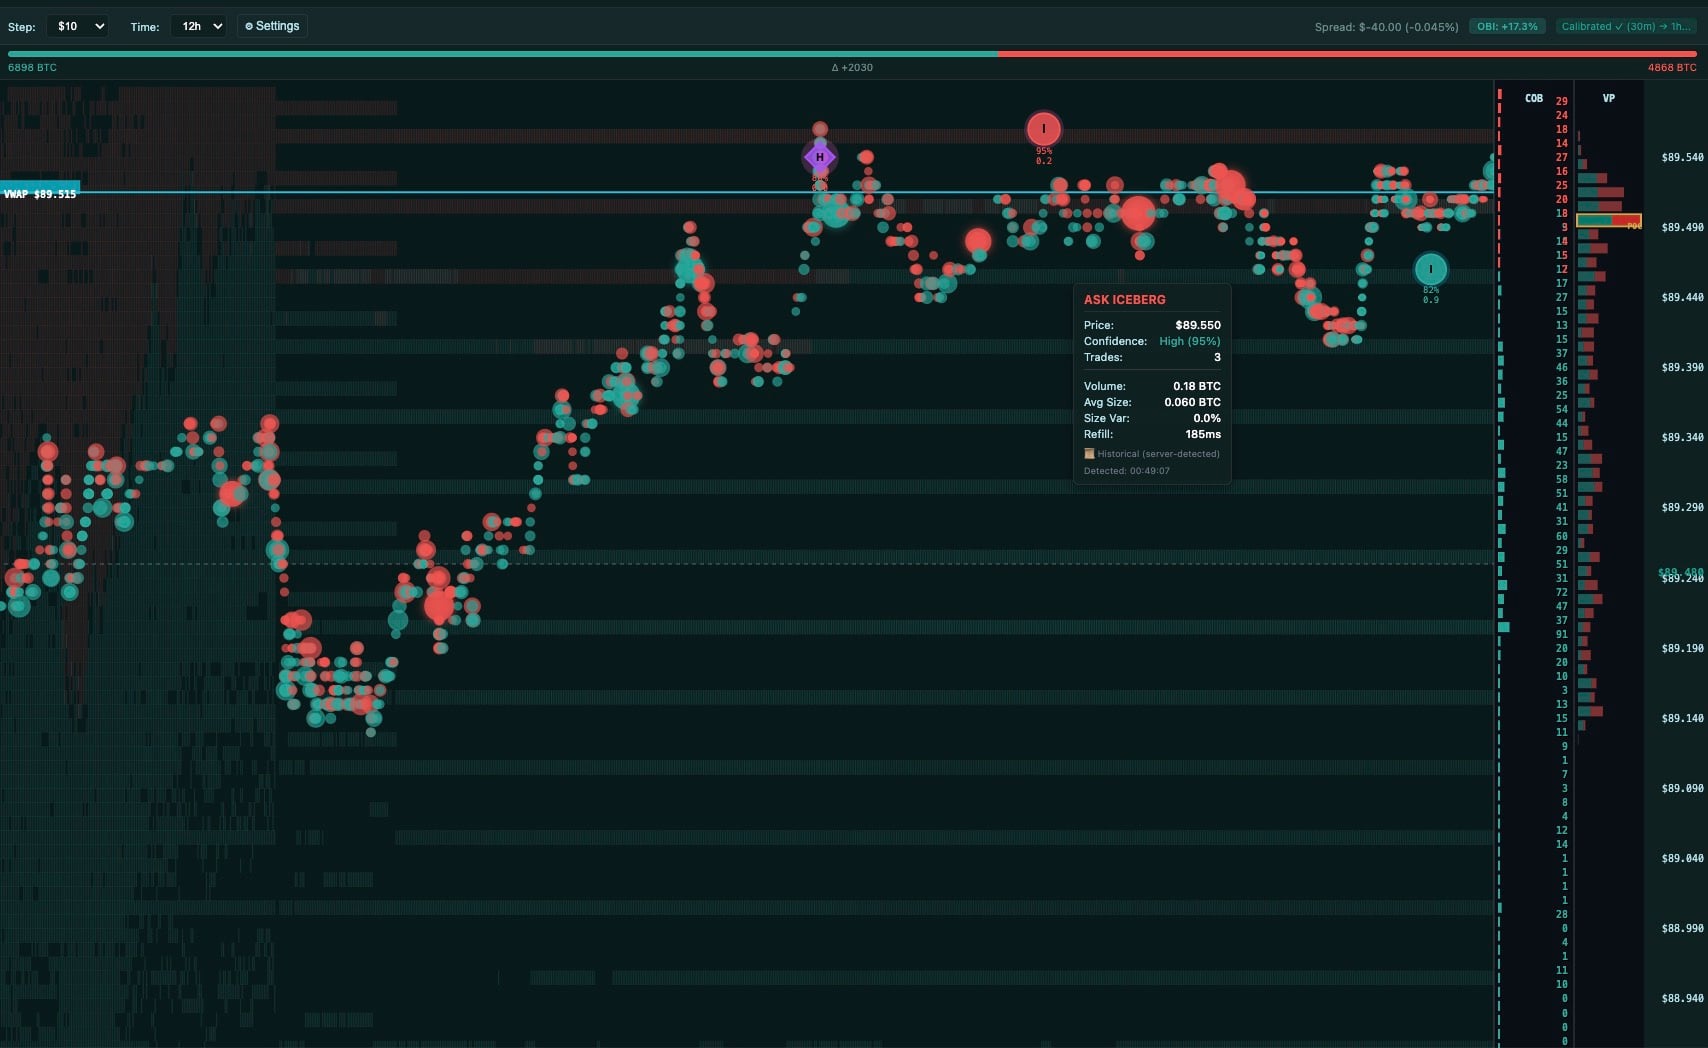
🧊 What Are Iceberg Orders?
An institutional player needs to sell 50 BTC . If they placed it all at once on the book, it would trigger panic selling. What do they do? Using algorithms, they split it into hundreds of 0.5 BTC pieces .
You only see that 0.5 on the book. You can't see the real wall.
Iceberg Detection
Detects iceberg orders with a 3-factor confidence score: trade size similarity (50%), refresh rate (25%), pattern consistency (25%). High confidence (>=70%) detections are highlighted with a glow effect.
🧊 LIVE DETECTIONOBI - Buyer/Seller Balance
Order Book Imbalance: Who is stronger? Buyers or sellers? See at a glance, catch the trend direction.
REAL-TIMEAbsorption
Large limit orders absorbing aggressive market orders. A level continuously tested with high volume but never broken = invisible support. Absorption + CVΔ direction change = very strong signal.
📊 WALL DETECTIONCVΔ (Cumulative Volume Delta)
Cumulatively measure the real buy-sell balance in the market. If CVΔ drops while price rises = bearish divergence. Binance, Bybit, Hyperliquid, and OKX data are combined.
LIVE DATAHidden Liquidity
The reason 90% of traders lose money. Was the trade bigger than the visible order? There was hidden liquidity!
👁️ HIDDEN ORDERTime Range Selector
1h, 2h, 3h, 4h, 6h, 12h, 24h, or 36 hours. Choose your time range, analyze the past.
⏱️ FLEXIBLE TIMEHistorical S/R Levels
The most tested historical support/resistance levels. See how many times they held with S45x, R38x labels!
📍 VWAP STYLELarge Trade Alerts
50+ BTC single-trade audio alert! Don't miss big moves with the "Volume incoming, attention" voice alert.
🔔 AUDIO ALERTDaily VWAP
Daily volume-weighted average price. The reference point for institutional buy/sell levels.
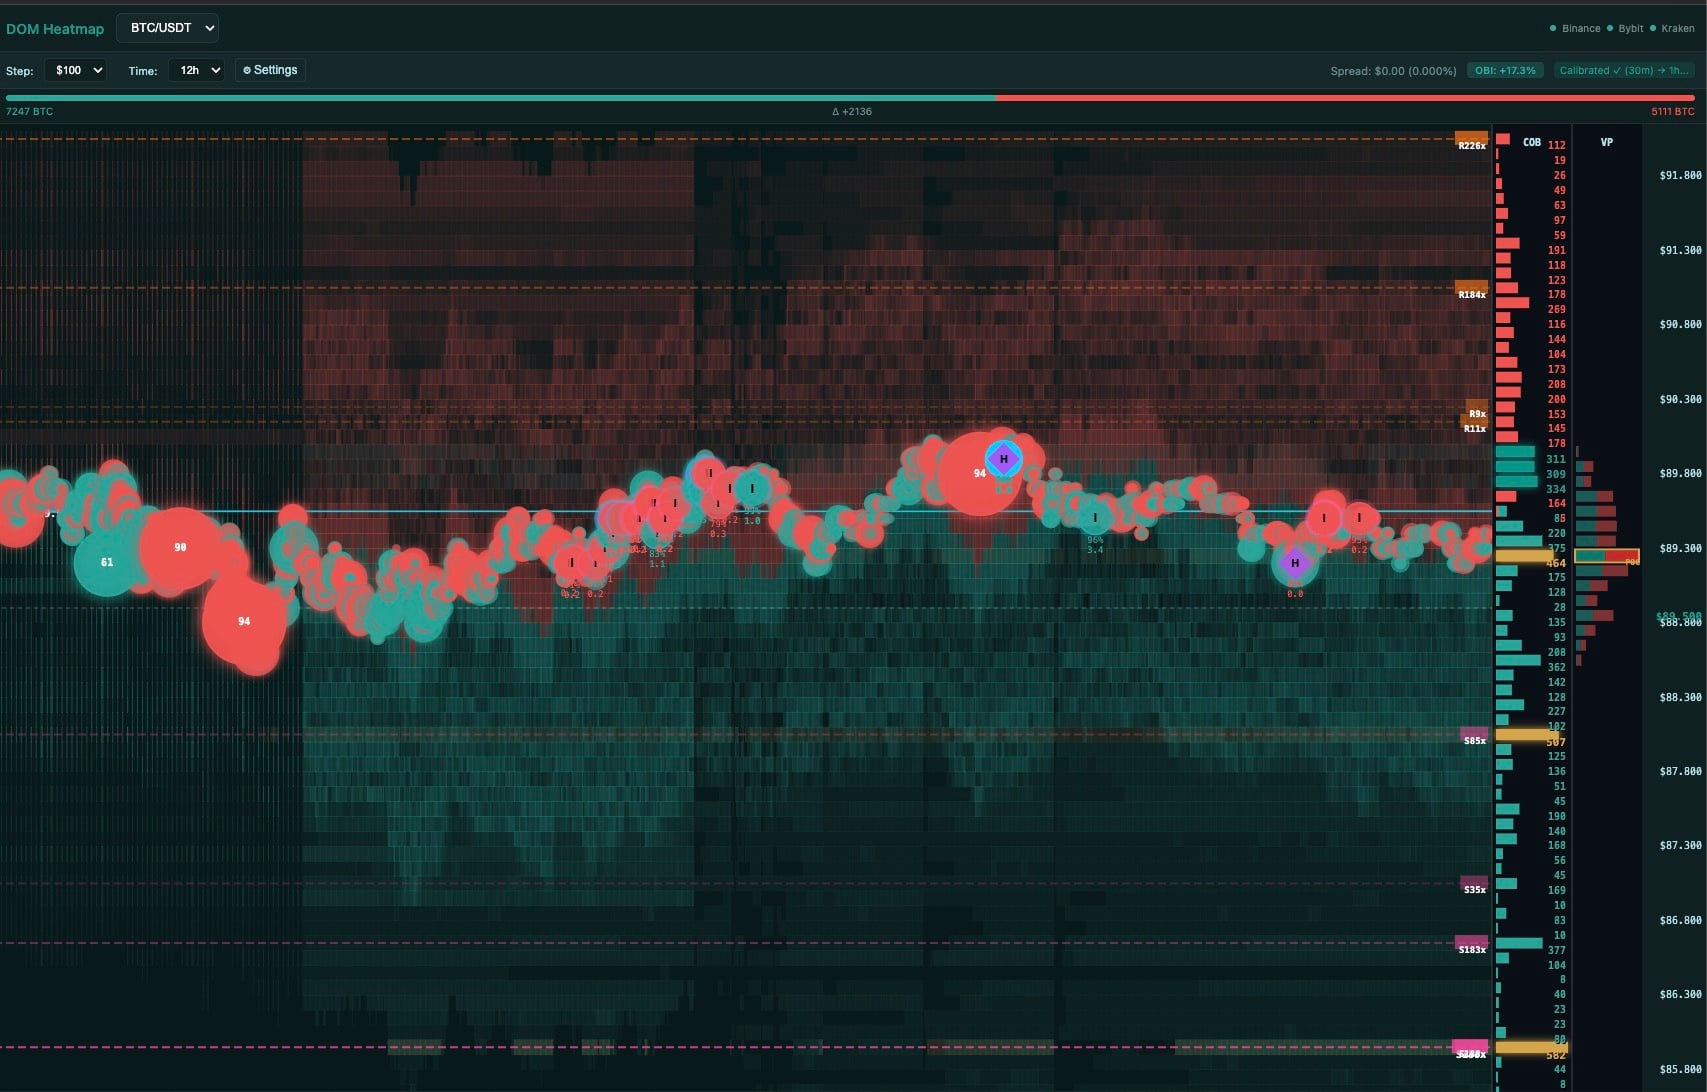
LIVE UPDATE🌐 Why 6 Exchanges at Once?
Big players spread their orders across exchanges to cover their tracks. We combine all the pieces and put the big picture in front of you.
Iceberg & Absorption Detection
Hidden orders are automatically flagged
Historical S/R + Daily VWAP
Historical levels with S45x, R38x labels
Large Trade Alerts (50+ BTC)
Don't miss big moves with audio alerts
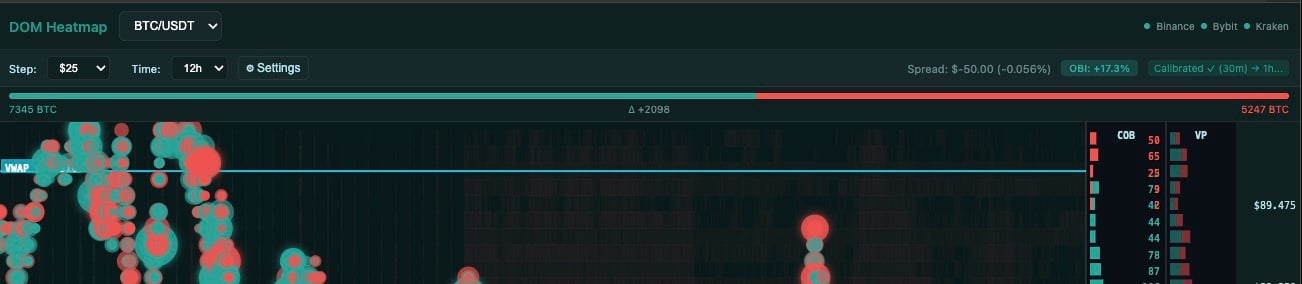
Delta, Spread, OBI & Time Range
Δ+2098 | Spread -0.056% | OBI +17.3%
💡 Bottom Line: You no longer need to guess where the whale is hiding. The system shows it to you live. Who's buying, who's selling, who's "pretending" but actually offloading positions... It's all right there in plain sight.
🎯 Auto-Calibration: The system automatically adjusts thresholds based on market conditions. You only see the signals that truly matter.
Professional Trading Tools
All the tools institutional traders use, on one platform
Multi-Chart Layouts
1, 2, 3, or 4 charts simultaneously. Each chart with independent symbol and timeframe. Professional multi-monitor support.
NEWLiquidation Heatmap
90-day liquidation data, 3-tier system: Tier 1 (low leverage, far), Tier 2 (medium), Tier 3 (high leverage, closest to price). Cascade moves start at Tier 3.
PRO DATAWhale Accumulation Zones
Top 5 long and 5 short accumulation zones from spot and futures position heatmap data. Zone sweep = major stop sweep alert.
PRO DATABull/Bear Trap
False breakout pattern detection + Scalp version. LONG/SHORT label, direction arrow, and percentage change. Normal: swing trade, Scalp: short-term pressure point.
AI POWEREDOpen Interest & Funding
Rising OI + Rising Price = strong trend. Declining OI + Rising Price = short squeeze. Extreme positive funding = contrarian short opportunity.
LIVEPrice Alert System
Create custom price alerts. Add notes to each alert, track trigger history.
NEWL/S Ratio & Crowding
Extreme long ratio + high OI + positive funding = market is overly optimistic. See CALM/WATCH/HOT+ states at a glance with Crowding Meters.
PRO DATAAI Anywhere Assistant
AI-powered analysis. LONG/SHORT signals, confidence ratios, whale/retail delta, and market sentiment.
AI POWEREDCrypto News Feed
Integrated news feed. Breaking news affecting the market, institutional developments, regulations -- all in real-time.
LIVECloud Craft SR
Volume-backed support/resistance zone detection. High-probability zones with pivot analysis + volume validation. Free version on TradingView. Kiyotaka Pro: Real buy/sell volume integration, 3-factor zone strength calculation (touch count + volume density + proximity), breakout confirmation and dynamic zone width.
Risk Reward Calculator
Position management and risk/reward calculation tool. Set entry, stop-loss, take-profit levels, see R:R ratio instantly. Free on TradingView.
FREE8 Proprietary Indicators, 6 Exchanges Unified Data -- You Won't Find This Anywhere Else
Join our Telegram community, learn together with 2,500+ traders.
Join the CommunityProprietary Indicators
8 proprietary tools found only on Cloud Craft -- not available on any other platform
CCraftVanga
Traditional indicators answer "up or down?" Vanga answers "WHEN?" Green zones = near-term reversal, purple zones = longer-term reversal. Use on 4H+ timeframes minimum. Best results on coins with long history (BTC, ETH).
Phantom Lights
Proprietary alert triggered at extreme crowding. 3 zones: DIP-ZONE (bottom alert), ATH-ZONE (top alert), ARA-ZONE (trend continuation). Rarely triggered -- when it appears, review your positions. Isolated alerts are stronger than clusters.
Master Degree Levels
Professional support/resistance level calculation
Drift Mode
Kumanchu's scalp version. Minute-based trend analysis. Macro (Kumanchu) bullish + Micro (Drift) bullish = strong long environment. Open your scalp trades in the direction of the macro trend.
Kumanchu Cloud Algo
Proprietary trend system. Calculates trend direction, signal strength, and Dynamic S/R zones from multiple perspectives. When all perspectives align = full alignment, enter on pullbacks.
Anchored VWAP
Customizable VWAP calculation and visualization
nPOC & W/nPOC
Untested POC levels = Price magnet. 365-day Daily + 52-week Weekly
Crowding Lines
Real-time crowding tracking with Crowding Lights + early warning with Crowding Meters at CALM/WATCH/HOT+ levels. If the Funding + L/S + Crowding trio all point the same way = reversal risk is very high.
The Right Level for You
Professional tools at every level -- choose what fits your needs
Starter
- ✓ DOM Heatmap Pro (6 exchanges)
- ✓ Volume Profile + Key Levels
- ✓ Liquidation Tools + Drift Mode
- ✓ Iceberg + Hidden Liquidity detection
Pro
- ✓ All Starter features
- ✓ Crowding Risk + Whale Zone panel
- ✓ Trap Package (Bull/Bear/Whale/Scalp)
- ✓ Kumanchu Cloud Algo + CloudCraft AI
- ✓ Weekly Intelligence Report
Elite -- Maximum Alpha
- ✓ All Pro features
- ✓ Phantom Lights + CCraftVanga
- ✓ Whale Signals
- ✓ Priority support + all future products
Top Bar Widgets
See the market pulse at a glance -- 5 real-time indicator panels
Multi-Platform Liquidation (24h)
6 exchanges' unified 24-hour liquidation data. Track long and short liquidation ratios in real-time.
LIVEMarket Maker Sentiment
Z-score based contrarian alerts. Detect moments of extreme optimism or pessimism -- stay on the opposite side of smart money.
Z-SCOREWhale Tracker
Large wallet positions and coin distribution. See which coins the whales are concentrated in.
WHALE DATAFear & Greed Index
0-100 contrarian indicator. Extreme Fear = buying opportunity, Extreme Greed = top risk. Measure market sentiment numerically.
SENTIMENTTop Trader Positions
$100K+ positions, Elite Whale badge. Track the position directions of the biggest traders.
ELITETrading Anywhere
Fully responsive design, flawless experience on mobile devices
Touch Optimized
44px+ touch targets, gesture support
Notch Support
Full iPhone safe area compatibility
Landscape Mode
Full chart experience in landscape mode
Fast Loading
Optimized performance
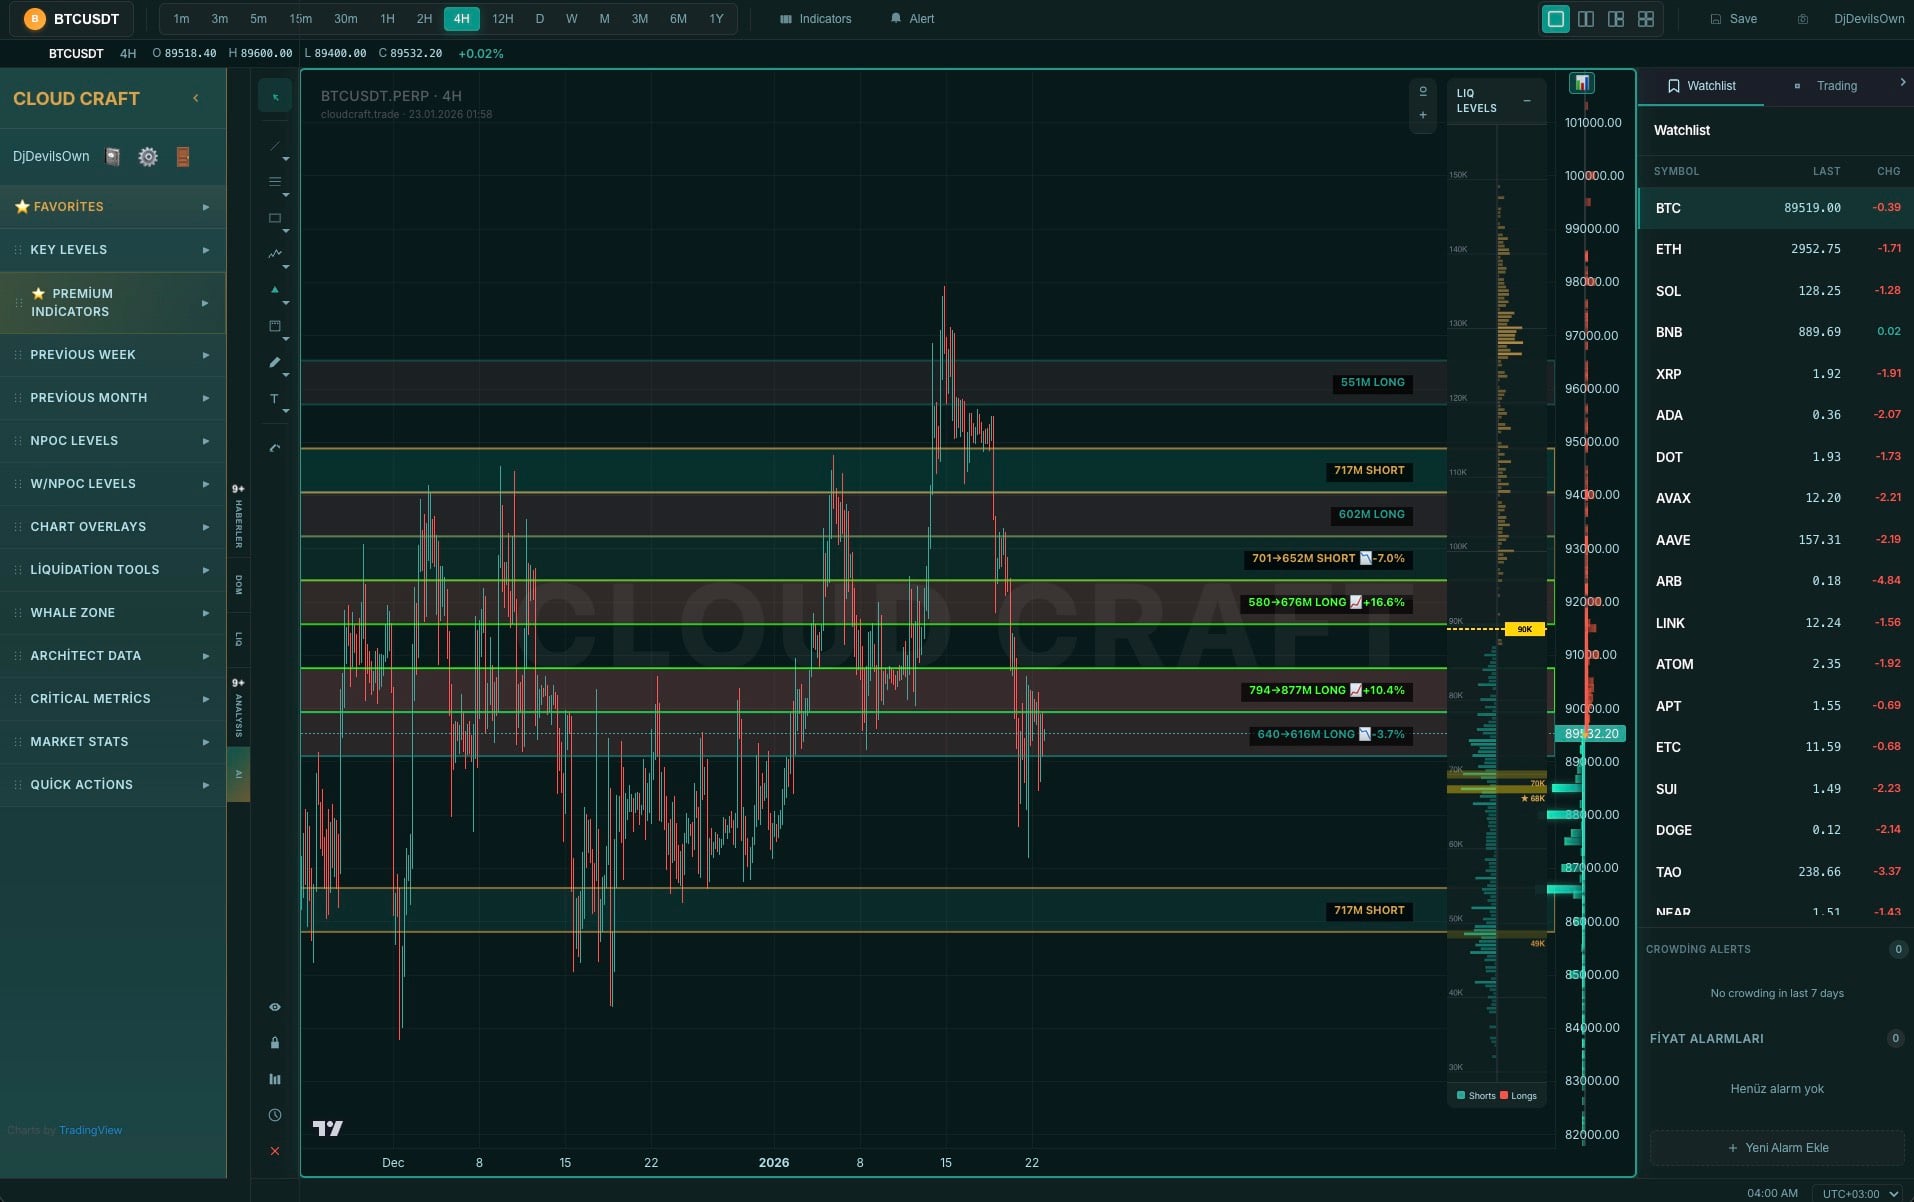
Interface Screenshots
Discover the terminal's powerful features
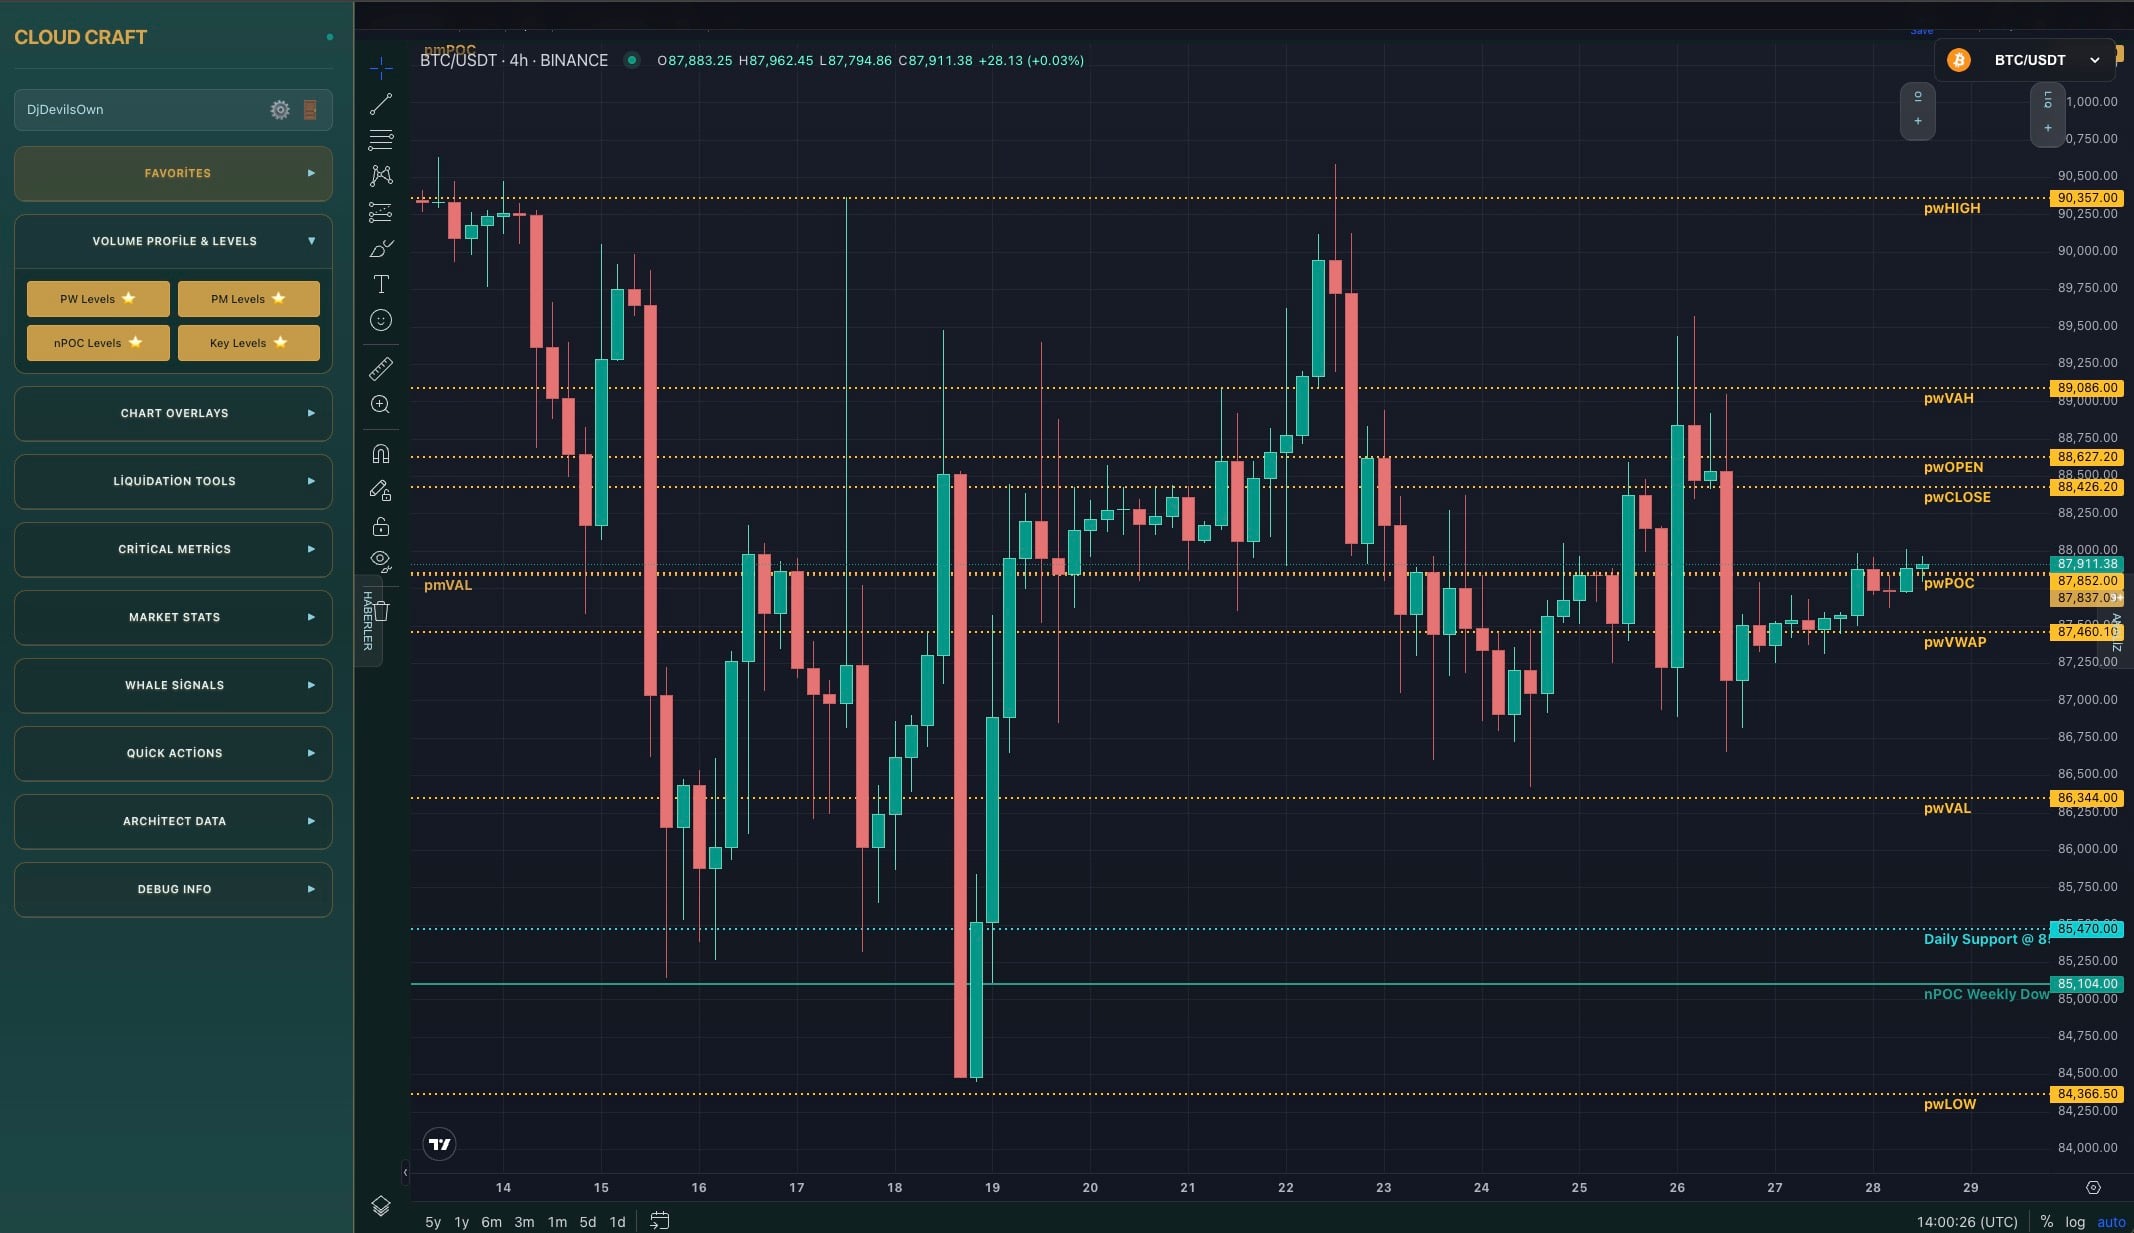
Volume Profile & Levels
PW, PM, nPOC levels and Key Levels at a glance
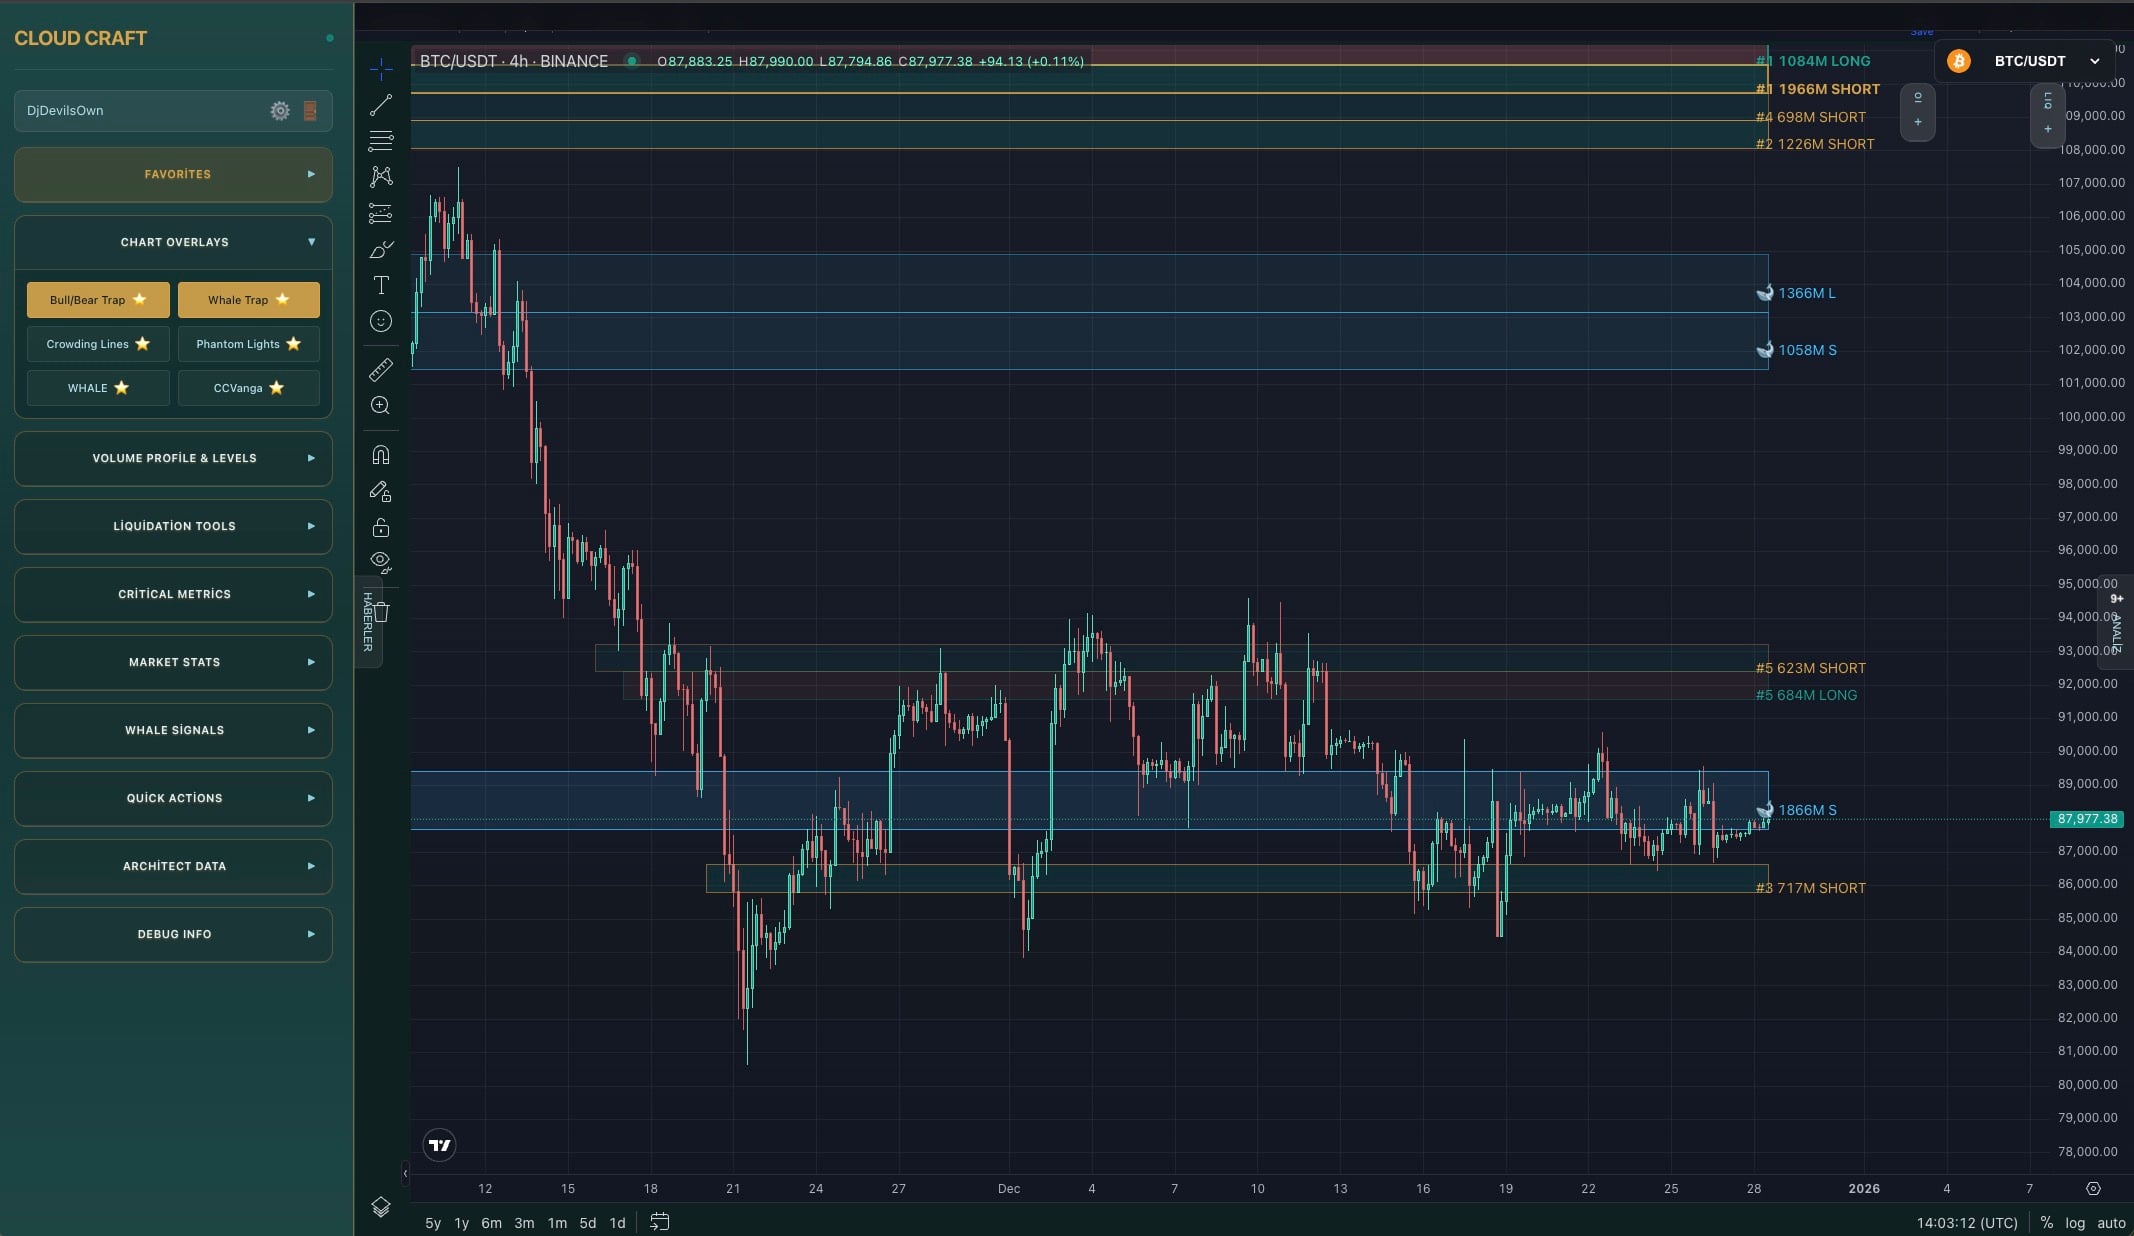
Chart Overlays
Bull/Bear, Whale Trap, Crowding Lines with one click
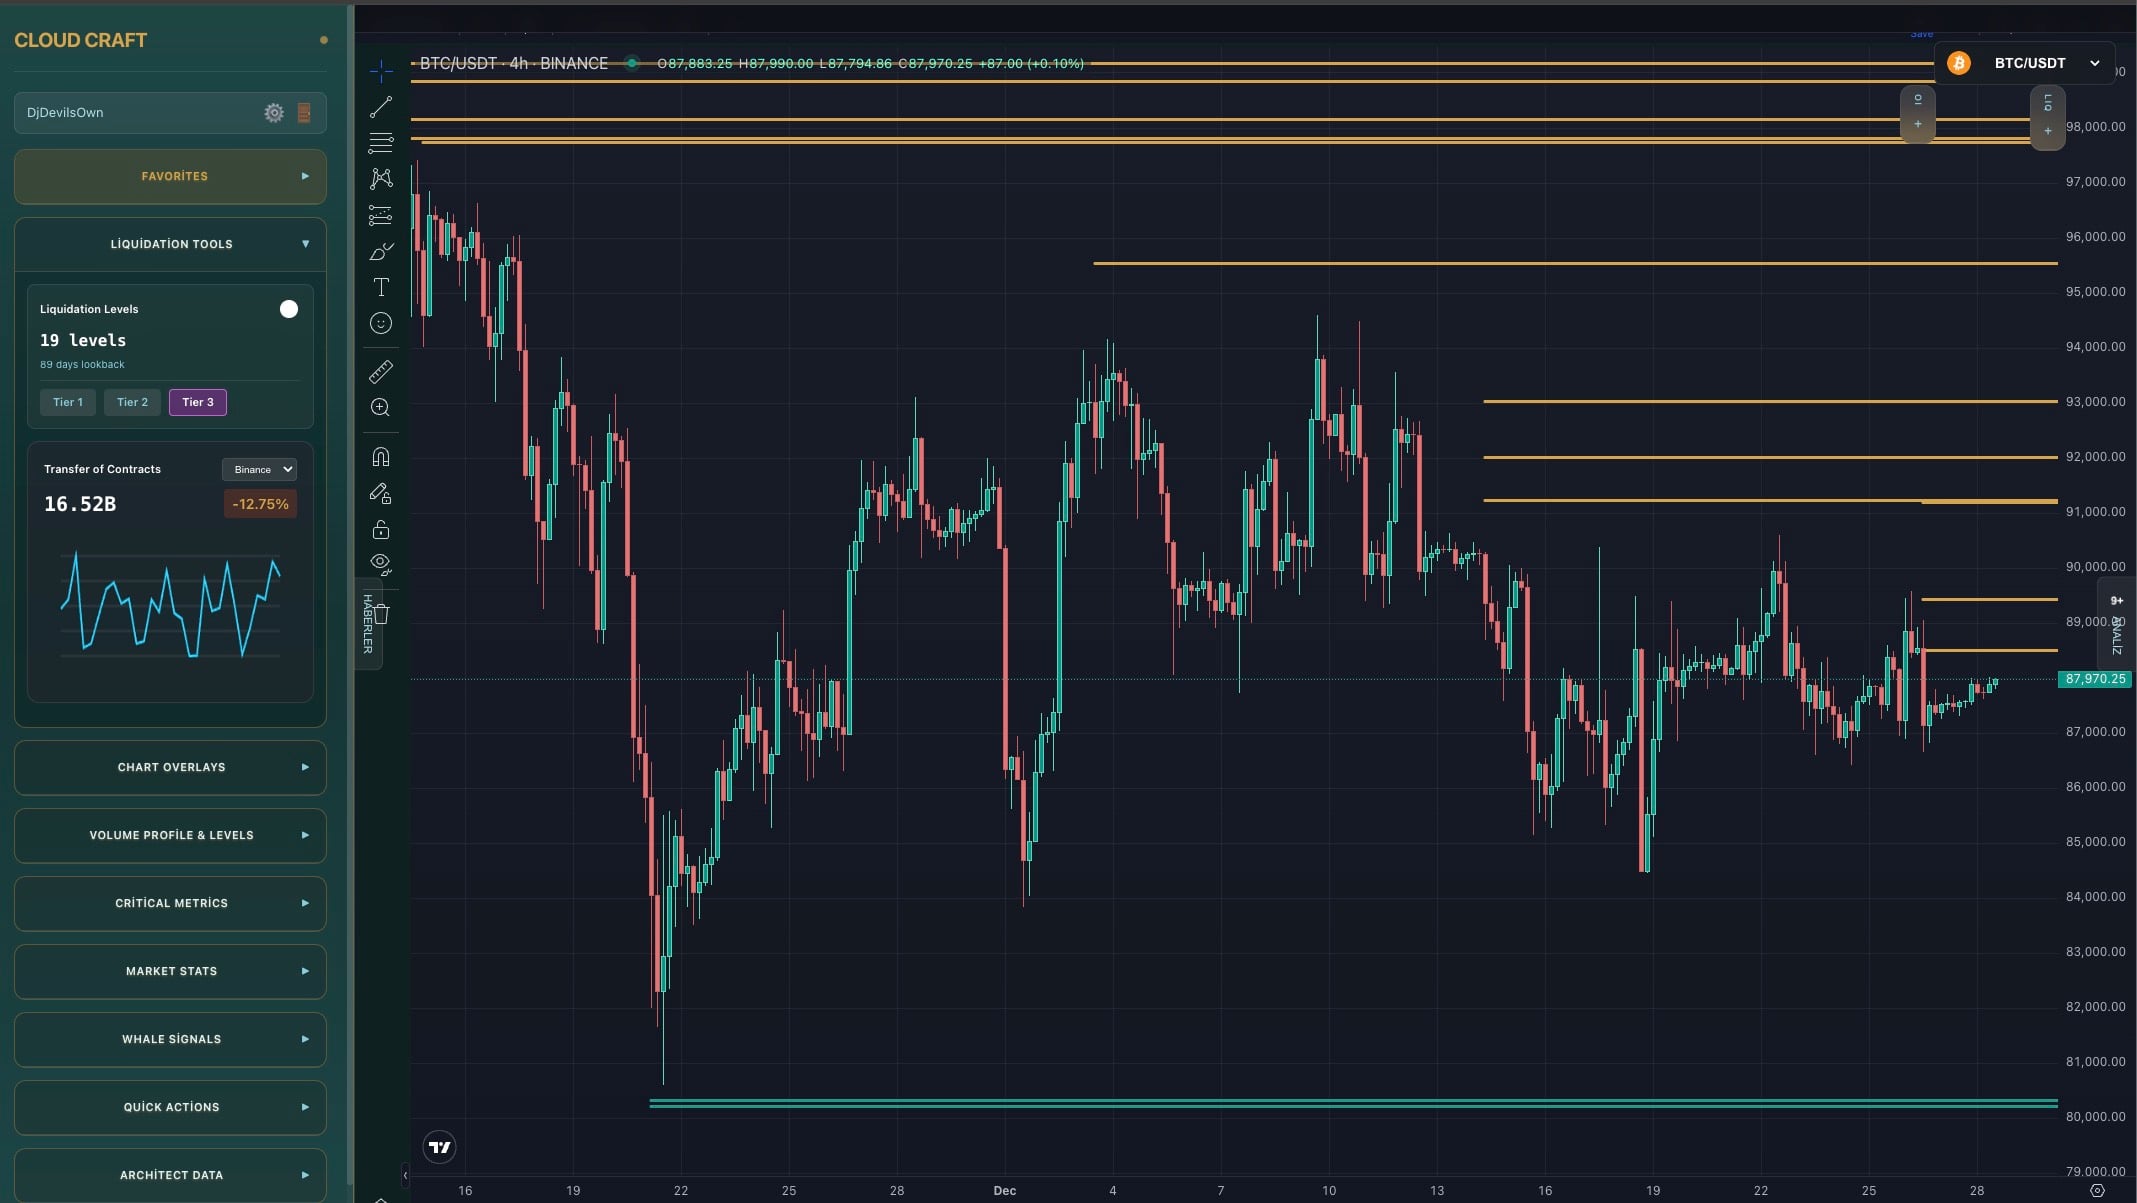
Liquidation Levels
Last 3 months' liquidity with Tier 1, 2, 3 filtering
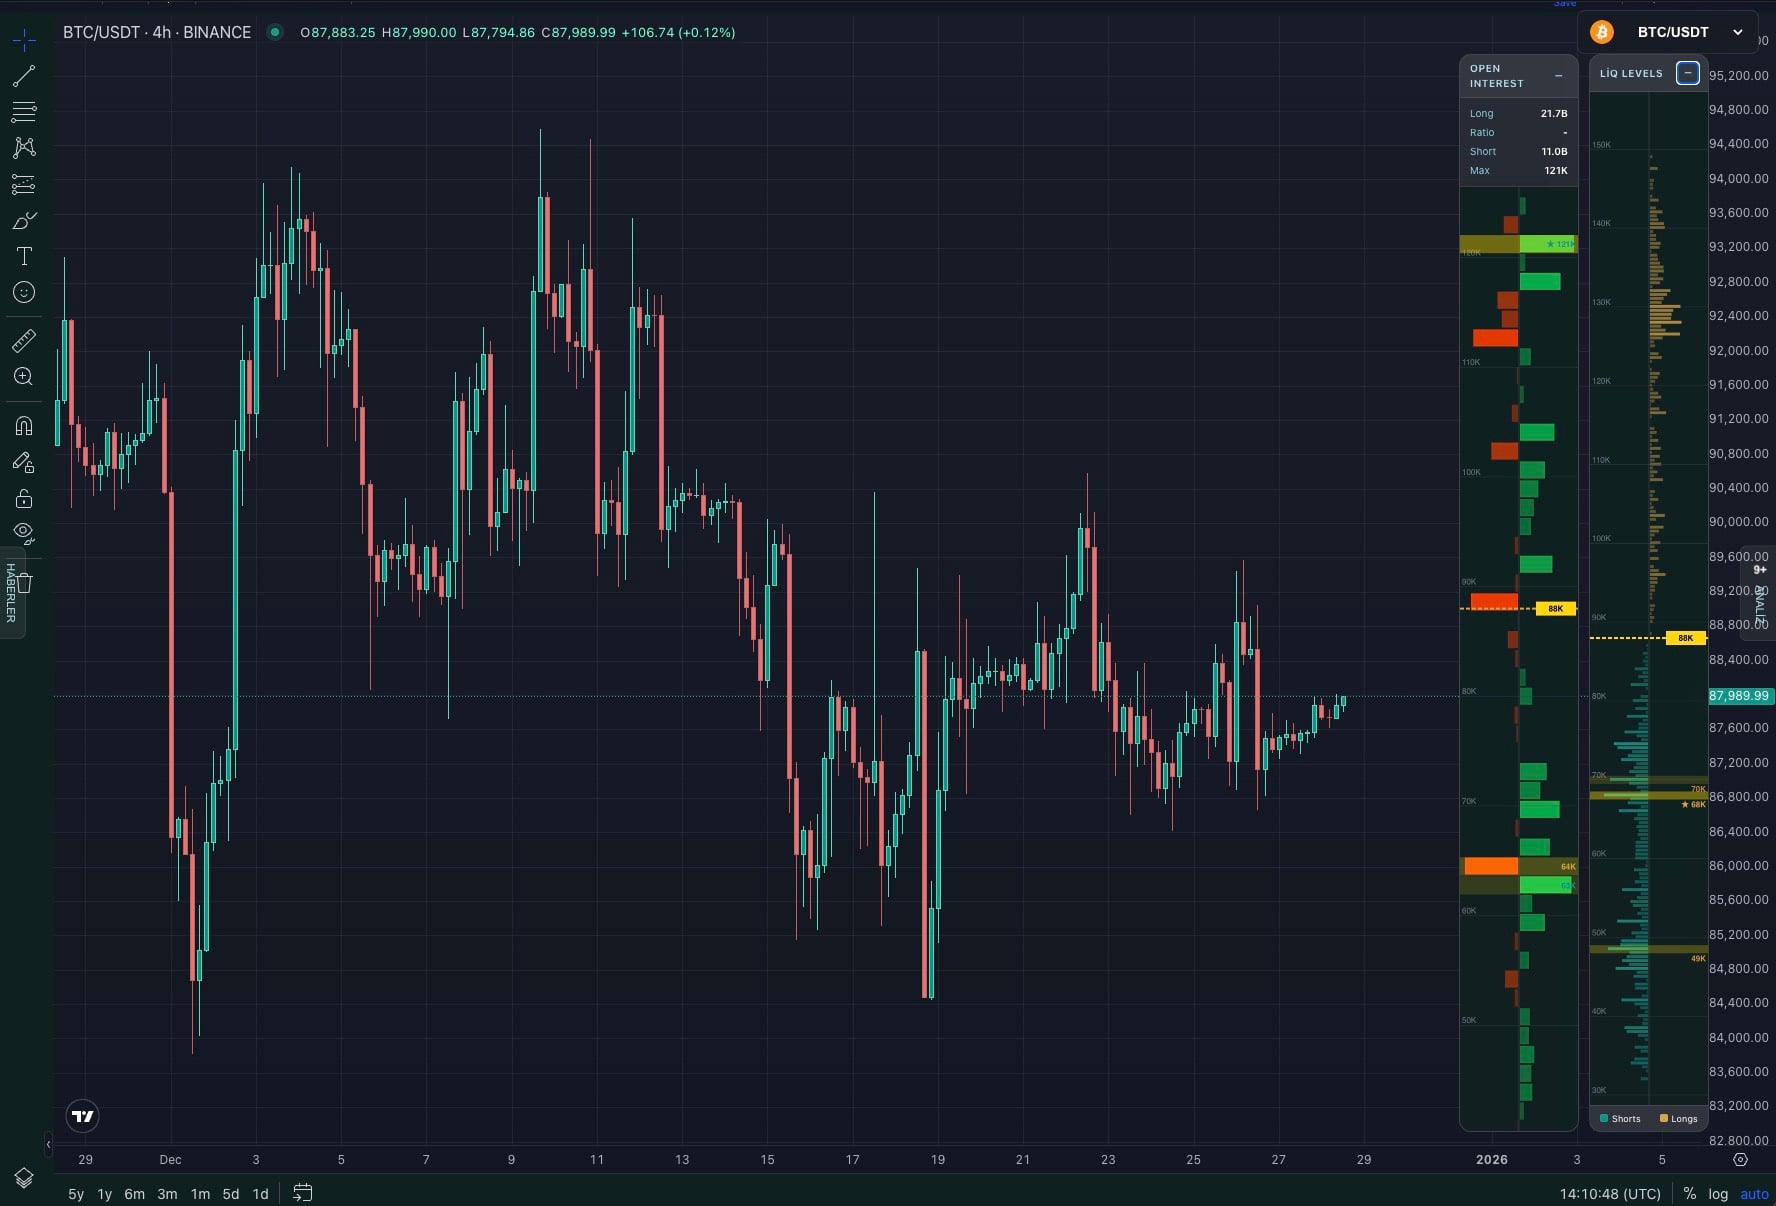
Open Interest & Heatmap
Live OI data and color-coded liquidation heatmap
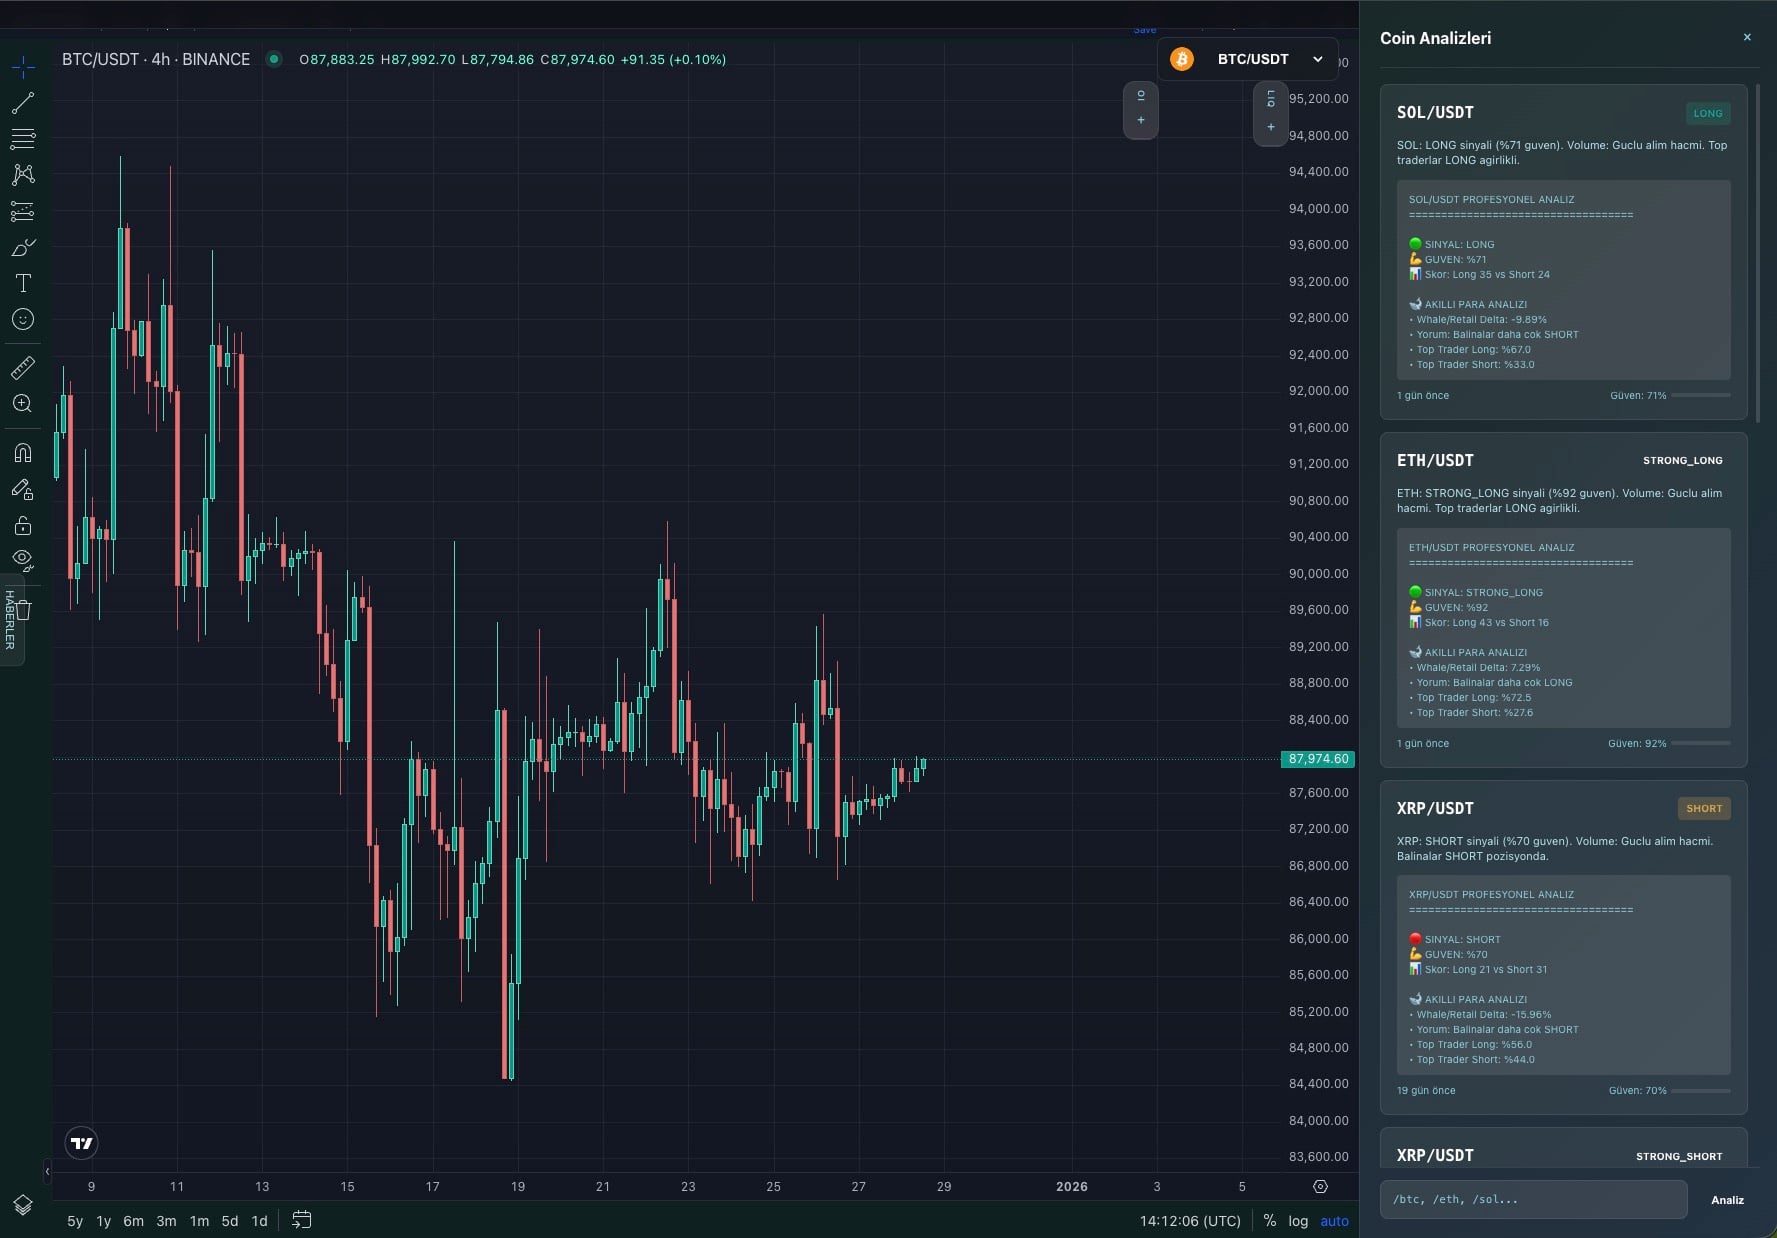
AI Coin Analysis
LONG/SHORT signals, confidence ratios, sentiment
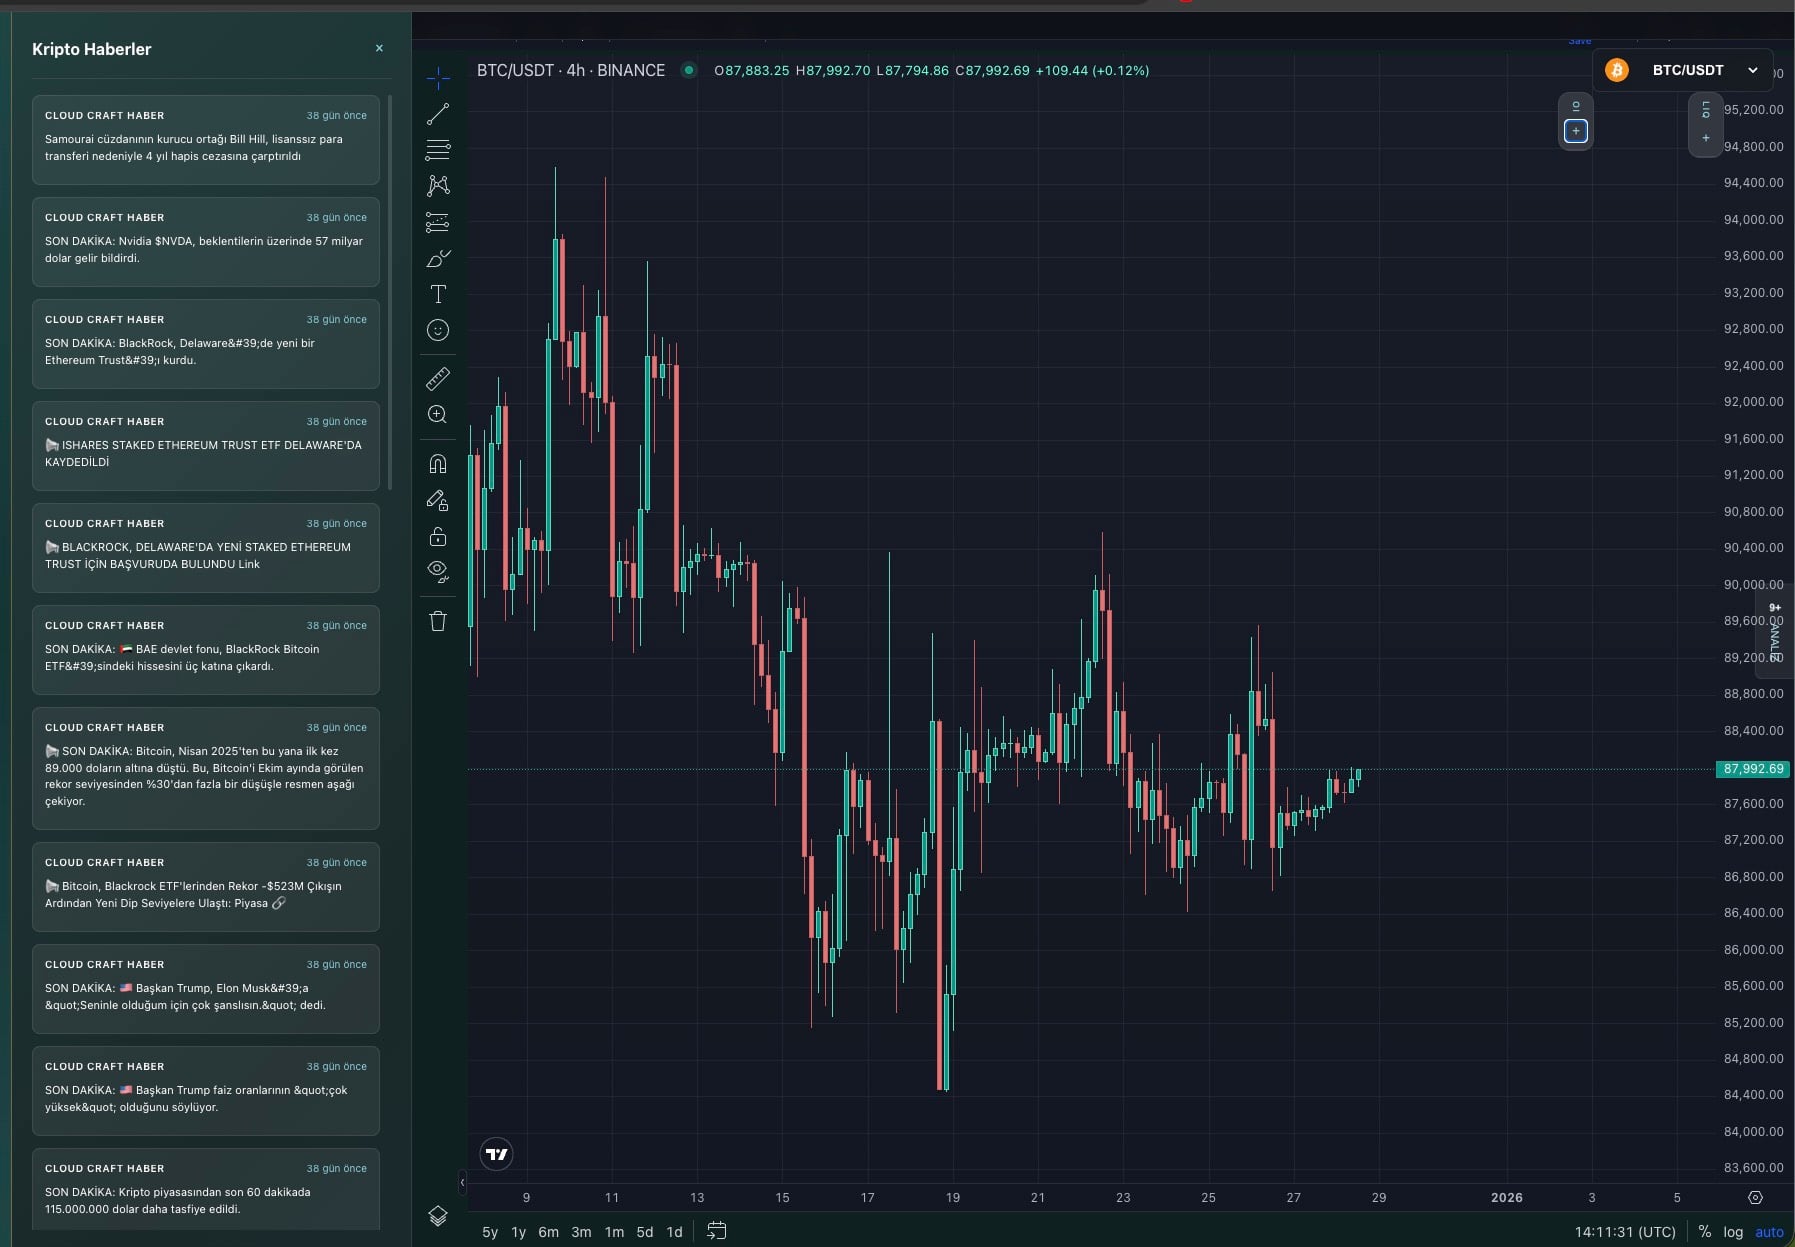
Crypto News
Breaking news, institutional investments
Crack the Smart Money Game
6 exchanges unified DOM, 90-day liquidation map, proprietary indicators... See what institutional traders see.
Learn first, then trade.